August 2017
Intermediate to advanced
254 pages
6h 10m
English
Once the solution is provisioned, we can navigate to the dashboard. This solution has different factories simulation implemented. It shows their location on the map view. The following charts show the overall equipment efficiency and some key performance indicator statuses and alerts:
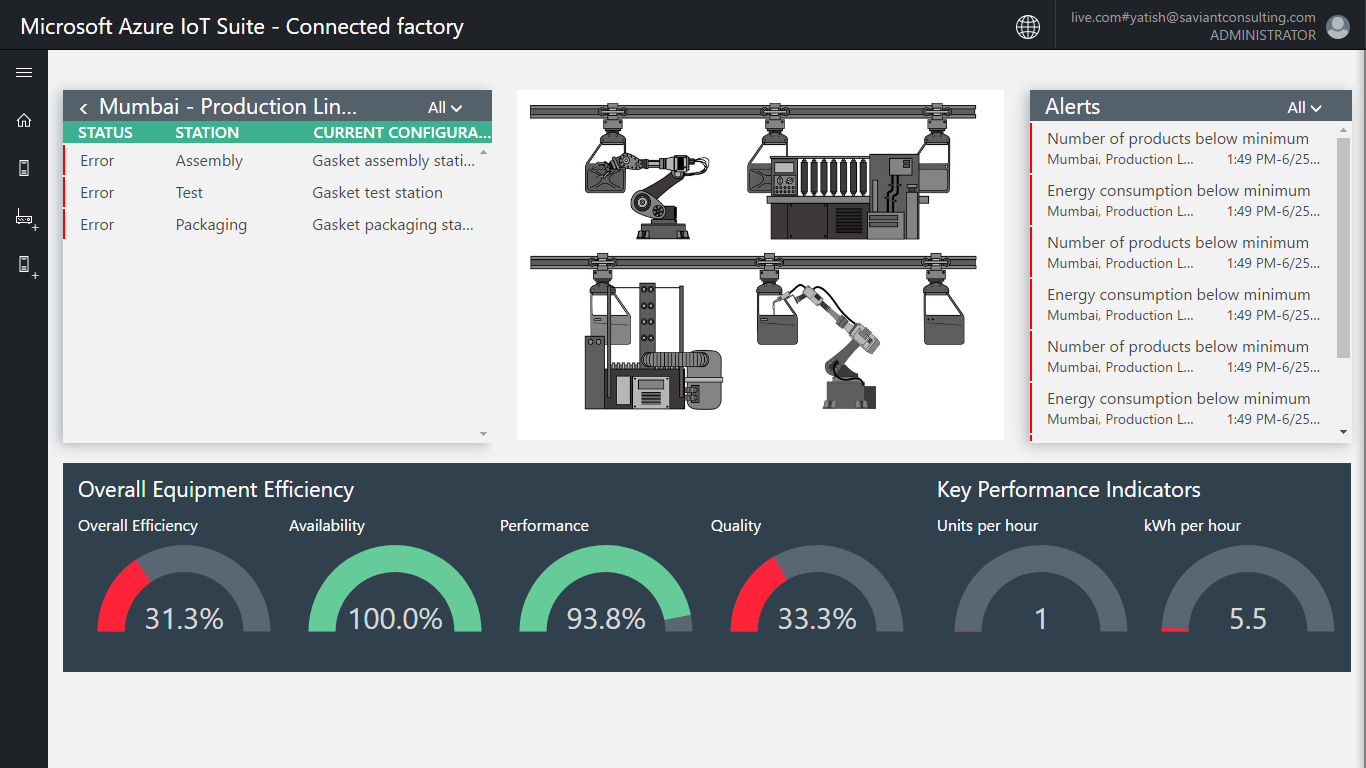
The factories panel allows us to select and drill down to any location and see the performance of the factory. It lists the status and configuration for the production line that we can select from.
The right panel shows the alerts based on the telemetry data. If an error occurs, it gets highlighted in this section:
We can even filter these for ...
Read now
Unlock full access


