February 2012
Beginner to intermediate
220 pages
5h 8m
English
If you are in possession of a collection of measurements that, as is usually the case, is subject to random errors, an attempt to simply plot a curve through the measurements may result in a chaotic graph that will be difficult to interpret. In these cases, one usually begins with a scatterplot, which is simply a plot of a dot or small symbol at each data point. An examination of such a plot often leads to the discovery of correlations or patterns.
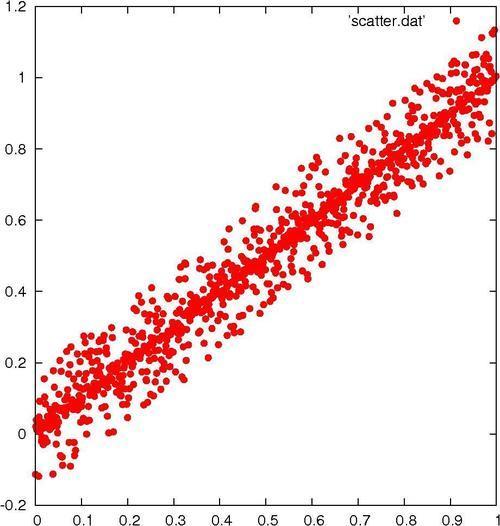
To make this recipe interesting, we need some slightly random-looking data. You may have some available, in which case you merely need to ensure that it is in a format ...
Read now
Unlock full access


