Making an impulse plot
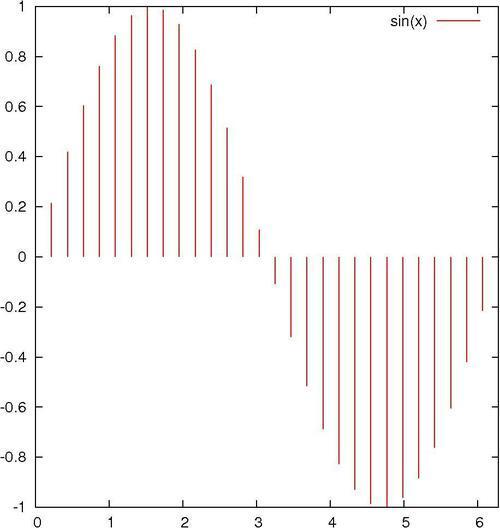
Impulse or stick plots are another way to represent discrete points. If the line thickness is made large, the impulse plot can be made to look like a bar chart.
How to do it…
The following script illustrates the use of the impulses style:
set samples 30
plot [0:2*pi] sin(x) with impulses lw 2
How it works…
The first command set the number of points used to sample or plot the function. The plot command tells gnuplot to use the impulse style, which draws a line from the x-axis to each y value; the thickness of the line is given by lw 2.
There's more…
A "stem plot" is sometimes used in electrical engineering. It is similar to the impulse ...
Get gnuplot Cookbook now with the O’Reilly learning platform.
O’Reilly members experience books, live events, courses curated by job role, and more from O’Reilly and nearly 200 top publishers.