Placing tics on the second y-axis
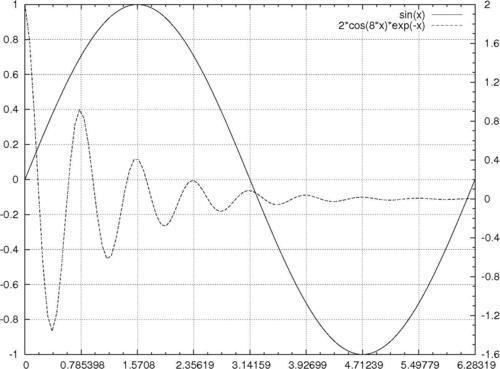
In this recipe, we revisit the technique introduced in Chapter 1, Plotting Curves, Boxes, Points, and more for plotting two curves on one graph, each with its own independent y-axis. The following figure provides an example for this recipe:
How to do it…
Run the following script through gnuplot to produce the previous figure:
set ytics nomirror
set y2tics 0.4
set my2tics 4
set xtics pi/4.
set mxtics 4
set grid
plot [0:2*pi] sin(x) axis x1y1, 2*cos(8*x)*exp(-x) axis x1y2
How it works…
As we saw in Chapter 1, Plotting Curves, Boxes, Points, and more, the command set ytics nomirror tells gnuplot to not duplicate the tics ...
Get gnuplot Cookbook now with the O’Reilly learning platform.
O’Reilly members experience books, live events, courses curated by job role, and more from O’Reilly and nearly 200 top publishers.