February 2012
Beginner to intermediate
220 pages
5h 8m
English
Here is one way to remove the tics entirely from the plot. This gives a clean and simple appearance for applications where you need an illustration and the reader is not expected to glean quantitative information from the graph.
A ticless graph is accomplished very simply. The following script produces the figure following it:
unset tics
plot [0:2*pi] x**2*sin(x)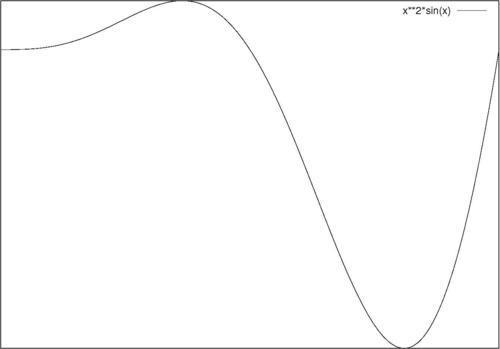
The highlighted line simply tells gnuplot to not draw tics; we still get a border around the plot, but no tic marks, and consequently, no numerical labels on the axes.
Read now
Unlock full access


