February 2012
Beginner to intermediate
220 pages
5h 8m
English
Back in Chapter 1, Plotting Curves, Boxes, Points, and more, we used parametric plotting to make graphs of complicated 2D paths. We can do the same thing in 3D to draw a complex curve in space.
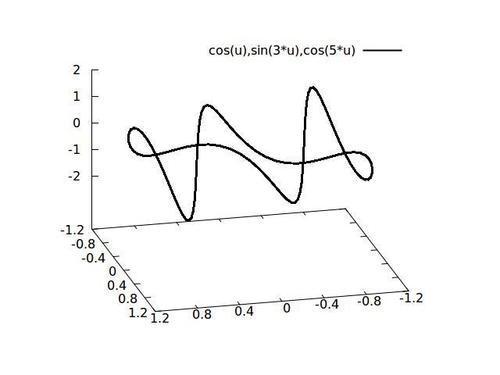
This might be thought of as a 3D Lissajous figure. The path intersects itself at several places.
Following is the code for the previous figure:
set samp 100
set xtics .4
set ytics .4
set parametric
set urange [-pi:pi]
set ztics 1
splot cos(u),sin(3*u),cos(5*u) lw 2
Note that the appearance of the plot will change radically depending on the viewpoint.
In exploring parametric plotting in 2D in Chapter 1, Plotting Curves, ...
Read now
Unlock full access


