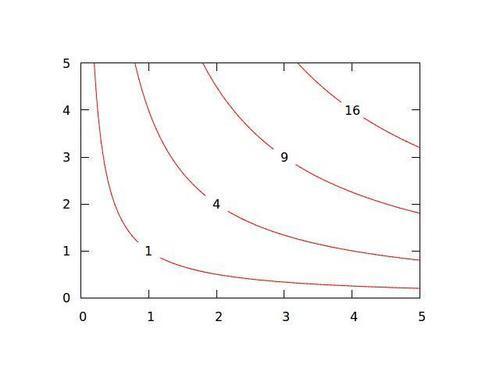
Making a labeled contour plot
We got an introduction to contour plots in Chapter 8, The Third Dimension, where we saw that the contours can be drawn in a sequence of dash-dot styles; the contour values can then be identified by referring to the legend that gnuplot constructs for us automatically.
There is another style of contour plot that incorporates numerical labels directly on the contours. gnuplot does not support this style directly, but can be tricked into compliance, as shown in the following figure:

How to do it…
Type the following script:
unset key unset surf set view map set contour base unset clabel set xrange [0:5] set yrange [0:5] set ...
Get gnuplot Cookbook now with the O’Reilly learning platform.
O’Reilly members experience books, live events, courses curated by job role, and more from O’Reilly and nearly 200 top publishers.

