February 2012
Beginner to intermediate
220 pages
5h 8m
English
The following style is popular in the classroom:
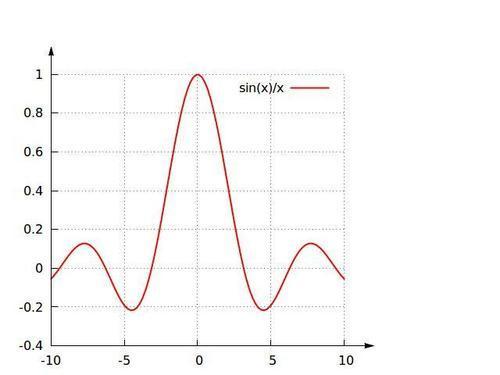
Notice that there is no border, but rather one pair of axes sporting arrows.
Execute the following script and you should see something very similar to the previous figure:
set arrow from graph 0,1 to graph 0,1.1 filled
set arrow from graph 1,0 to graph 1.1,0 filled
set tmargin 5
set rmargin 20
set border 3
set tics nomirror
set grid
plot sin(x)/x lw 2
We learned about arrows in Chapter 2, Annotating with Labels and Legends. The first two lines define two arrows positioned using the graph coordinate system. This coordinate system is ideal for our purposes ...
Read now
Unlock full access


