February 2012
Beginner to intermediate
220 pages
5h 8m
English
The default gnuplot style gives roughly equal visual prominence to both the axes and tics and to the actual curves being plotted. Some may prefer the aesthetic properties of the style of plot illustrated in the following figure. In this graph, the curve is made to stand out by rendering the tics labels, border, and background grid in a lighter shade and using a thicker line for the curve:
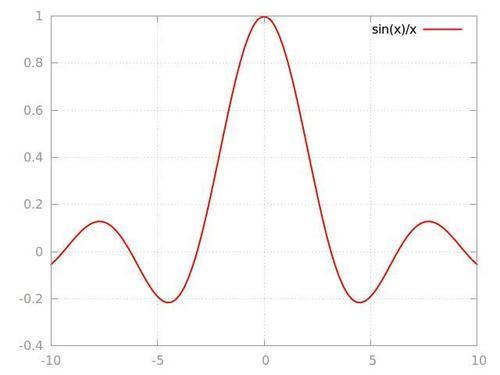
Load the following script into gnuplot to see the result:
set style line 2 lc rgb '#999999' lt 0 #grid
set style line 1 lc rgb '#999999' lt 1 #border
set grid linestyle 2
set border linestyle 1
plot sin(x)/x lw 2
The
Read now
Unlock full access


