February 2012
Beginner to intermediate
220 pages
5h 8m
English
This recipe shows you how to make the simplest step-type histogram. Later, we will build histogram and statistical plots on this, but sometimes this is all you need. The following figure shows a simple step-type histogram:
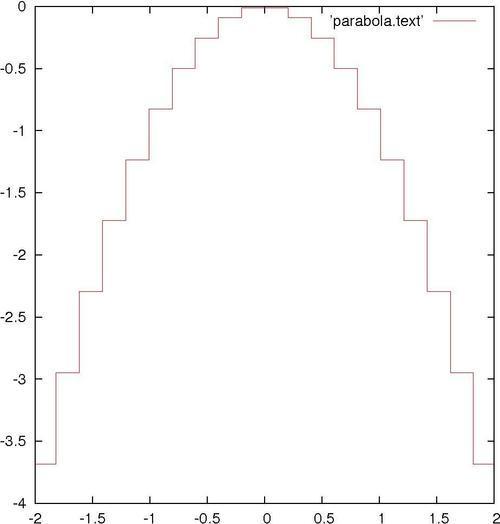
We're going to plot a part of our file parabola.text, so make sure that's still available. Of course, if you have your own sorted statistical data that will probably be more interesting.
Type the following command to make a histogram plot:
plot [-2:2] 'parabola.text' with histeps
As we can see, rather than drawing a line through a series of x-y points, the histeps ...
Read now
Unlock full access


