October 2012
Intermediate to advanced
250 pages
6h 3m
English
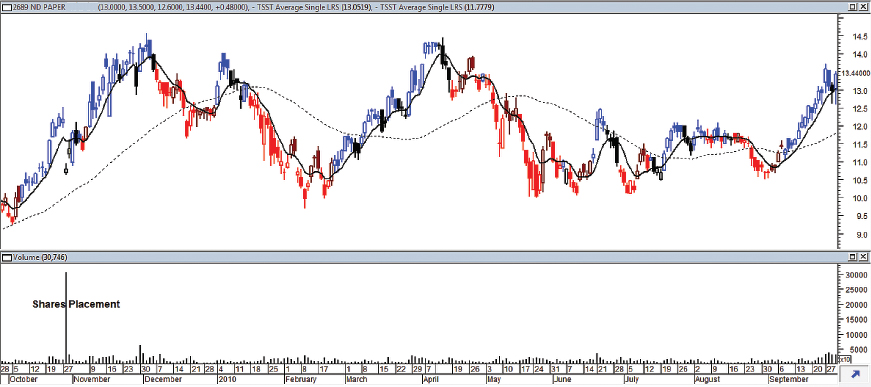
Volume represents the number of stocks transacted between buyers and sellers during a specified period, as shown in Figure 5.1. The period may be one day, one week, or one hour. The specified length of the period depends on the analyst. If we wish to arrive at a short-term view of the market, the price and volume should be analyzed daily or even hourly. On the other hand, a longer-term analysis would require a longer time frame. To determine the trend of volume, a running record should be maintained to compare the daily volume with previous figures. However, there is no standard rule as to the requisite number of days that should be used. Volume is generally plotted as a histogram below the corresponding price action.
FIGURE 5.1 The daily volume of the stock is shown in the bottom window. Note the huge placement of shares in October 2009, which suppresses the scale of the rest of the daily plots, making them difficult to read.
Read now
Unlock full access


 O’Reilly covers everything we've got, with content to help us build a world-class technology community, upgrade the capabilities and competencies of our teams, and improve overall team performance as well as their engagement.I wanted to learn C and C++, but it didn't click for me until I picked up an O'Reilly book. When I went on the O’Reilly platform, I was astonished to find all the books there, plus live events and sandboxes so you could play around with the technology.I’ve been on the O’Reilly platform for more than eight years. I use a couple of learning platforms, but I'm on O'Reilly more than anybody else. When you're there, you start learning. I'm never disappointed.I'm always learning. So when I got on to O'Reilly, I was like a kid in a candy store. There are playlists. There are answers. There's on-demand training. It's worth its weight in gold, in terms of what it allows me to do.