October 2012
Intermediate to advanced
250 pages
6h 3m
English
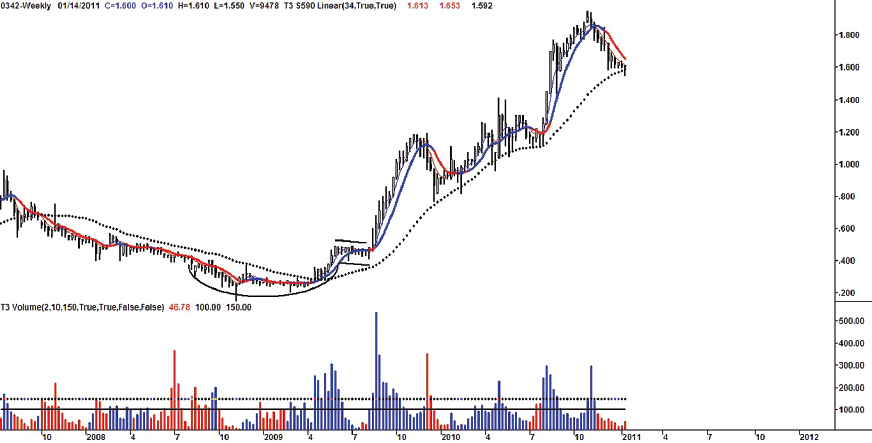
Saucer bottom formations belong to the group of patterns that seemingly have curve-line or rounding turns. Prices during the period of formation, especially at the rounding turns, have low volatility and move narrowly, forming a gradual bowl shape. Saucer bottoms are found at the end of a downward trend and are considered to be bullish reversal patterns. The initial downward slope indicates an excess of supply. The excess supply forces prices downward until buyers enter the market at the low price at the bottom, which increases the demand for the stock. Once the rounding is complete, the prices break out and continue in an upward trend.
Saucer patterns can also be referred to as cup-and-handle patterns when, upon a breakout of the pattern, prices retrace to form a right handle that drifts slightly downward. This pattern’s time frame varies from several weeks to several months. The longer it lasts, the more significant it becomes. (See Figures 3.25 and 3.26.)
FIGURE 3.25 In this chart, the completion of the saucer pattern coincides with the crossover of the 50-day moving average (50-DMA) over the 200-day moving average (200-DMA).
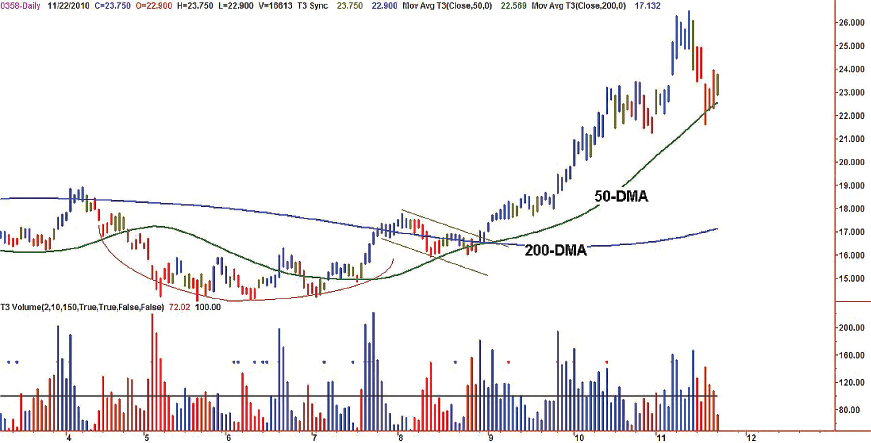
FIGURE 3.26 A typical cup-and-handle formation showing extreme volume upon breakout of the right handle of the pattern.
As prices move ...
Read now
Unlock full access


 O’Reilly covers everything we've got, with content to help us build a world-class technology community, upgrade the capabilities and competencies of our teams, and improve overall team performance as well as their engagement.I wanted to learn C and C++, but it didn't click for me until I picked up an O'Reilly book. When I went on the O’Reilly platform, I was astonished to find all the books there, plus live events and sandboxes so you could play around with the technology.I’ve been on the O’Reilly platform for more than eight years. I use a couple of learning platforms, but I'm on O'Reilly more than anybody else. When you're there, you start learning. I'm never disappointed.I'm always learning. So when I got on to O'Reilly, I was like a kid in a candy store. There are playlists. There are answers. There's on-demand training. It's worth its weight in gold, in terms of what it allows me to do.