March 2013
Beginner
148 pages
3h 18m
English
What Do We Know?
We’ve discussed our problem and put it into context. We now understand our objectives and decisions. It is time to consider uncertainty (although the decision tree does get us started on the uncertainty discussion). A good way to discuss uncertainty is to use a tool called the influence diagram.
An influence diagram is a graphical representation of a problem, which shows (Figure 5.1)
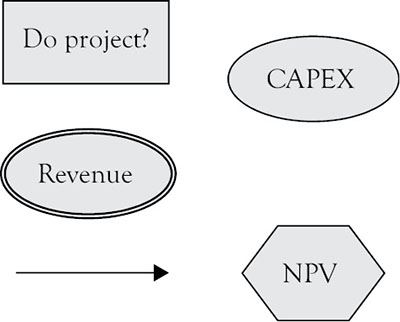
Figure 5.1. Influence diagram components.
• decisions as squares or rectangles,
• uncertainties as ovals or circles,
• calculated variables as double-lined ovals,
• measures of value as hexagons,
• relationships and ...
Read now
Unlock full access


