Testing for the existence of humps
Tree models can be useful in assessing whether or not there is a hump in the relationship between y and x. This is difficult to do using other kinds of regression, because linear models seldom distinguish between humps and asymptotes. If a tree model puts a lower section at the right of the graph than in the centre, then this hints at the presence of a hump in the data. Likewise, if it puts an elevated section at the left-hand end of the x axis then that is indicative of a U-shaped function.
Here is a function called hump which extracts information from a tree model to draw the stepped function through a scatterplot:
hump<-function(x,y){
library(tree)
model<-tree(y~x)
xs<-grep("[0-9]",model[[1]][[5]])
xv<-as.numeric(substring(model[[1]][[5]][xs],2,10))
xv<-xv[1:(length(xv)/2)]
xv<-c(min(x),sort(xv),max(x))
yv<-model[[1]][[4]][model[[1]][[1]]=="<leaf>"]
plot(x,y, xlab=deparse(substitute(x)),ylab=deparse(substitute(y)))
i<-1
j<-2
k<-1
b<-2*length(yv)+1
for (a in 1:b){
lines(c(xv[i],xv[j]),c(yv[k],yv[i]))
if (a %% 2 == 0 ){
j<-j+1
k<-k+1 }
else{
i<-i+1
}}}
We shall test it on the ethanol data which are definitely humped (p. 840):
library(lattice)
attach(ethanol)
names(ethanol)

[1] "NOx" "C" "E"

hump(E,NOx)
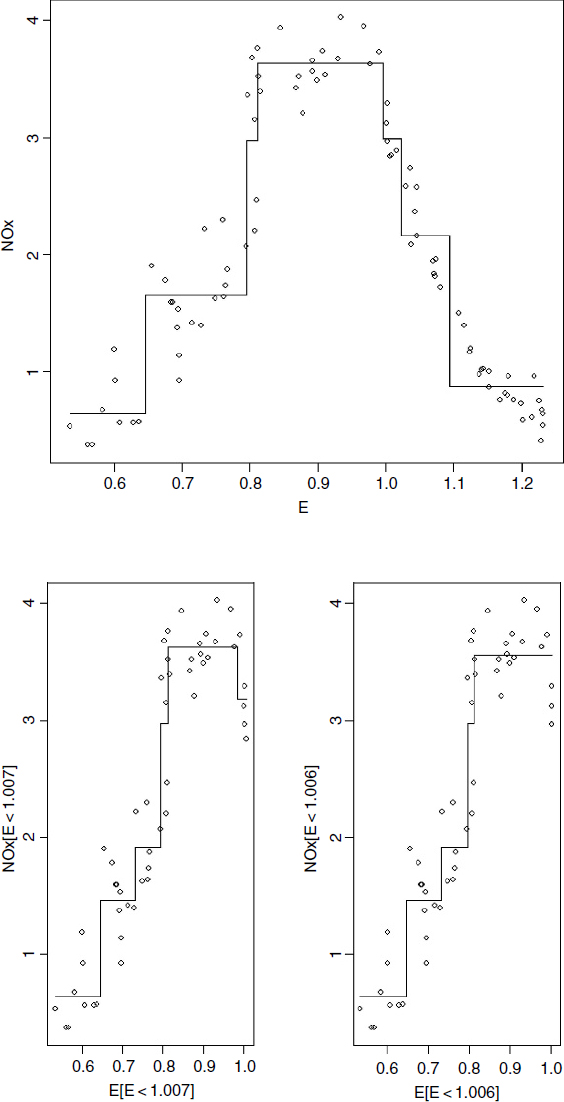
There is a minimum number of points necessary for creating a new step (n = 5), and a minimum difference in the mean of one group and the next. ...
Get The R Book now with the O’Reilly learning platform.
O’Reilly members experience books, live events, courses curated by job role, and more from O’Reilly and nearly 200 top publishers.