143Road Safety
6.7.2.2 Traffic Accidents Occurred at Nakahata Curve
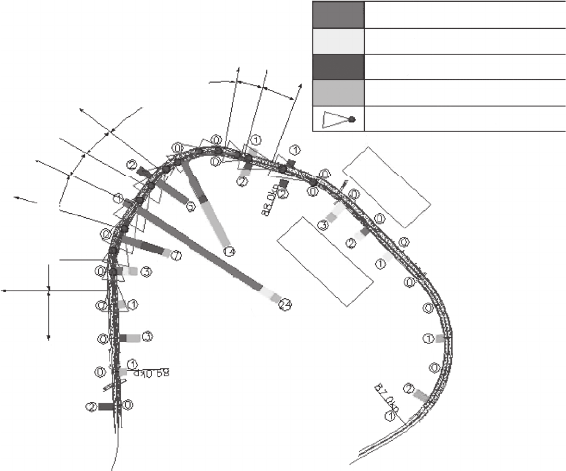
Figure6.6 indicates the location and the types of accidents recorded at
Nakahata Curve in 2002. For convenience and considering the horizon-
tal alignment of the road, the studied section is assumed to be classied
into the nine subsections shown in Figure6.6.
Judging from Figure 6.6, it can be said that the section with the
highest number of accidents is the third transition curve between the
short, straight section and the second curve, which has a diameter of
300 m. The number of accidents in this section reached twenty-four in
2002. Further, the second highest number of ...