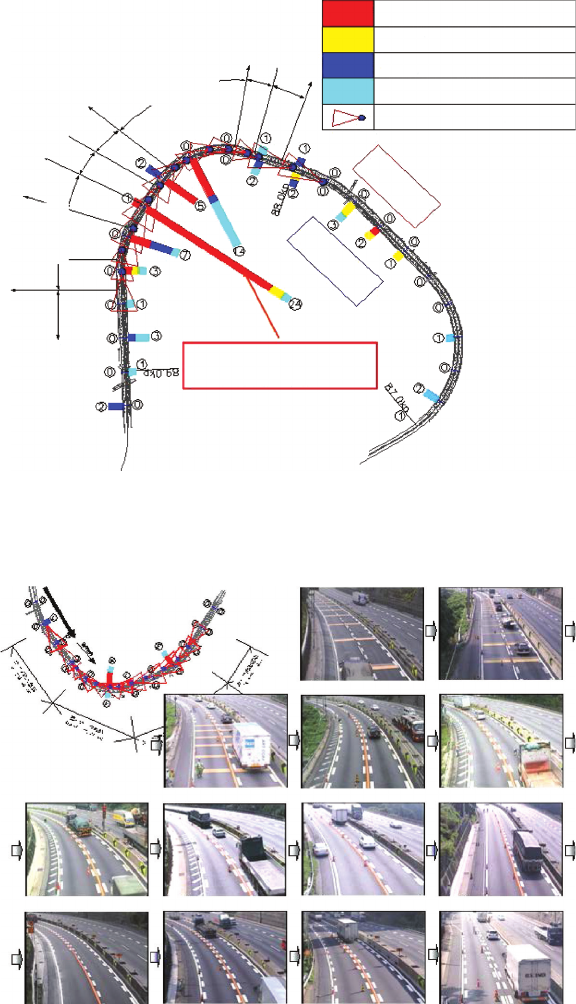
Number of accidents
causing injured
persons and families
Number of accidents
causing damage vehicle
and facility only
Number of lane departure and collision
with barrier
1st
transition
curve
1st Curve
R = 200 m
Curve
R = 300 m
2nd
transition
curve
3rd
transition
curve
4th transition
curve
Straight 1
Straight 2
C11
C12
C13
C14
C10
C9
C8
C7
C6
C5
C4
C3
C2
Number of Lane Department &
Collision with Barrier
Straight 3
Number of accidents involving single
vehicle except lane departure
Number of rear-end collision
Number of accidents involving multiple
vehicles except rear-end collision
Location of video camera and covered
Area
FIGURE 6.6 Location and type of accidents recorded at Nakahata ...