March 2017
Beginner to intermediate
866 pages
18h 4m
English
So far in this chapter, we have learnt:
However, there are other issues that need to be taken care of while dealing with data sources of different types. Let's go through them one by one. We will be using a different (simulated) dataset to illustrate these issues. Let's import it and have a look at it:
import pandas as pd
df=pd.read_csv('E:/Personal/Learning/Predictive Modeling Book/Book Datasets/Linear Regression/Ecom Expense.csv')
df.head()
We should get the following output:
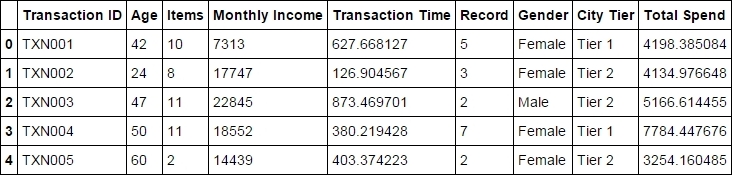
Fig. 5.17: ...