Skip to Content
Python: Data Analytics and Visualization
book

Python: Data Analytics and Visualization

by Phuong Vo.T.H, Martin Czygan, Ashish Kumar, Kirthi Raman
March 2017
Beginner to intermediate
866 pages
18h 4m
English
Packt Publishing
Content preview from Python: Data Analytics and Visualization

Fine-tuning the clustering

Deciding the optimum value of K is one of the tough parts while performing a k-means clustering. There are a few methods that can be used to do this.

The elbow method

We earlier discussed that a good cluster is defined by the compactness between the observations of that cluster. The compactness is quantified by something called intra-cluster distance. The intra-cluster distance for a cluster is essentially the sum of pair-wise distances between all possible pairs of points in that cluster.

If we denote intra-cluster distance by W, then for a cluster k intra-cluster, the distance can be denoted by:

The elbow method

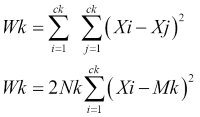
Generally, the normalized ...

Become an O’Reilly member and get unlimited access to this title plus top books and audiobooks from O’Reilly and nearly 200 top publishers, thousands of courses curated by job role, 150+ live events each month,
and much more.
Start your free trial

You might also like

Practical Python Data Visualization: A Fast Track Approach To Learning Data Visualization With Python

Practical Python Data Visualization: A Fast Track Approach To Learning Data Visualization With Python

Ashwin Pajankar
Python: End-to-end Data Analysis

Python: End-to-end Data Analysis

Phuong Vothihong, Martin Czygan, Ivan Idris, Magnus Vilhelm Persson, Luiz Felipe Martins

Publisher Resources

ISBN: 9781788290098Supplemental ContentPurchase Link