September 2017
Beginner to intermediate
560 pages
25h 18m
English
By default, the hist() function automatically determines the number of bars to display, based on the data. The breaks argument controls this.
You can also use a palette of colors instead of a single color, by using the following command:
> hist(mpg, col = rainbow(12))
The following diagram is the colored histogram:
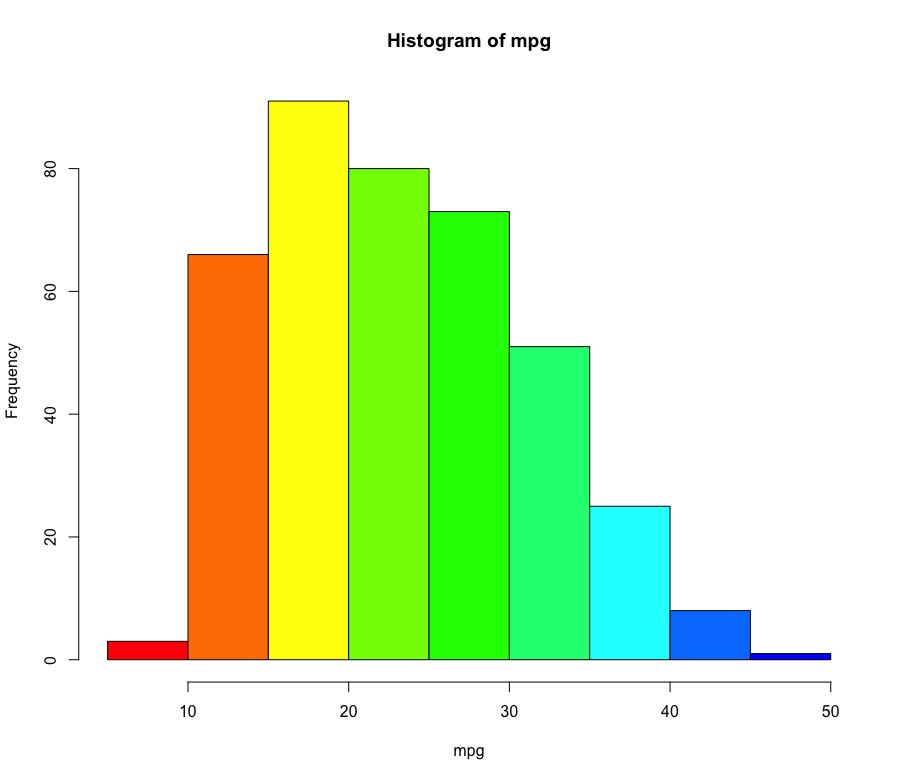
The rainbow() function returns a color palette with the color spectrum broken into the number of distinct colors specified, and the hist() function uses one color for each bar.
Read now
Unlock full access


