September 2017
Beginner to intermediate
560 pages
25h 18m
English
To create the plot, follow these steps.
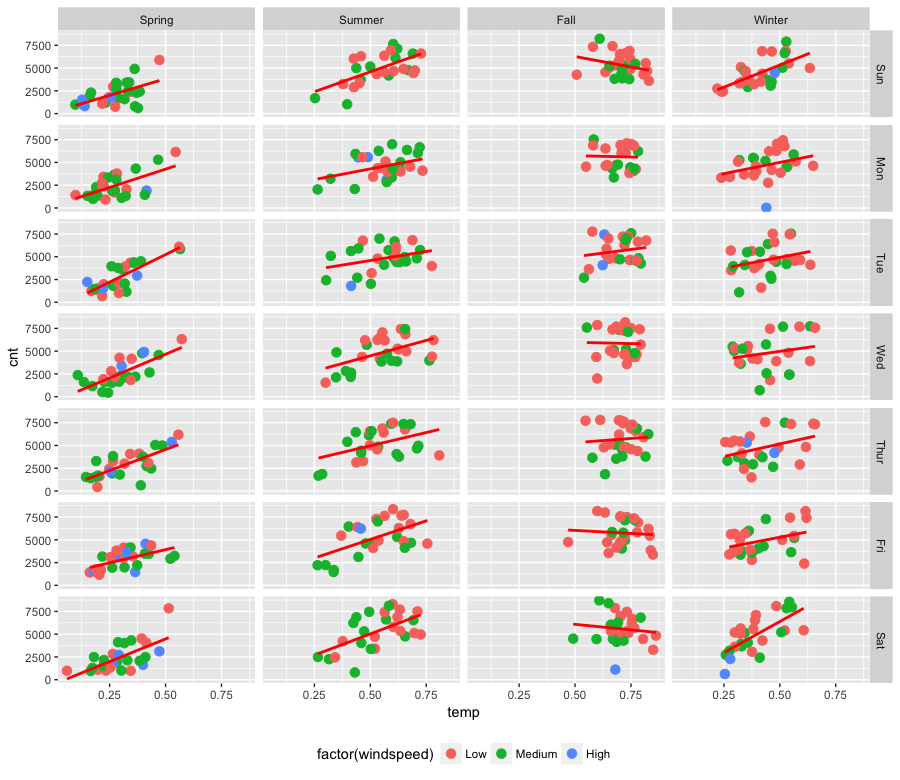
> plot <- ggplot(bike,aes(temp,cnt)) > plot + geom_point(size=3, aes(color=factor(windspeed))) + geom_smooth(method="lm", se=FALSE, col="red") + facet_grid(weekday ~ season) + theme(legend.position="bottom")
The preceding commands produce the following output:
Read now
Unlock full access


