September 2017
Beginner to intermediate
560 pages
25h 18m
English
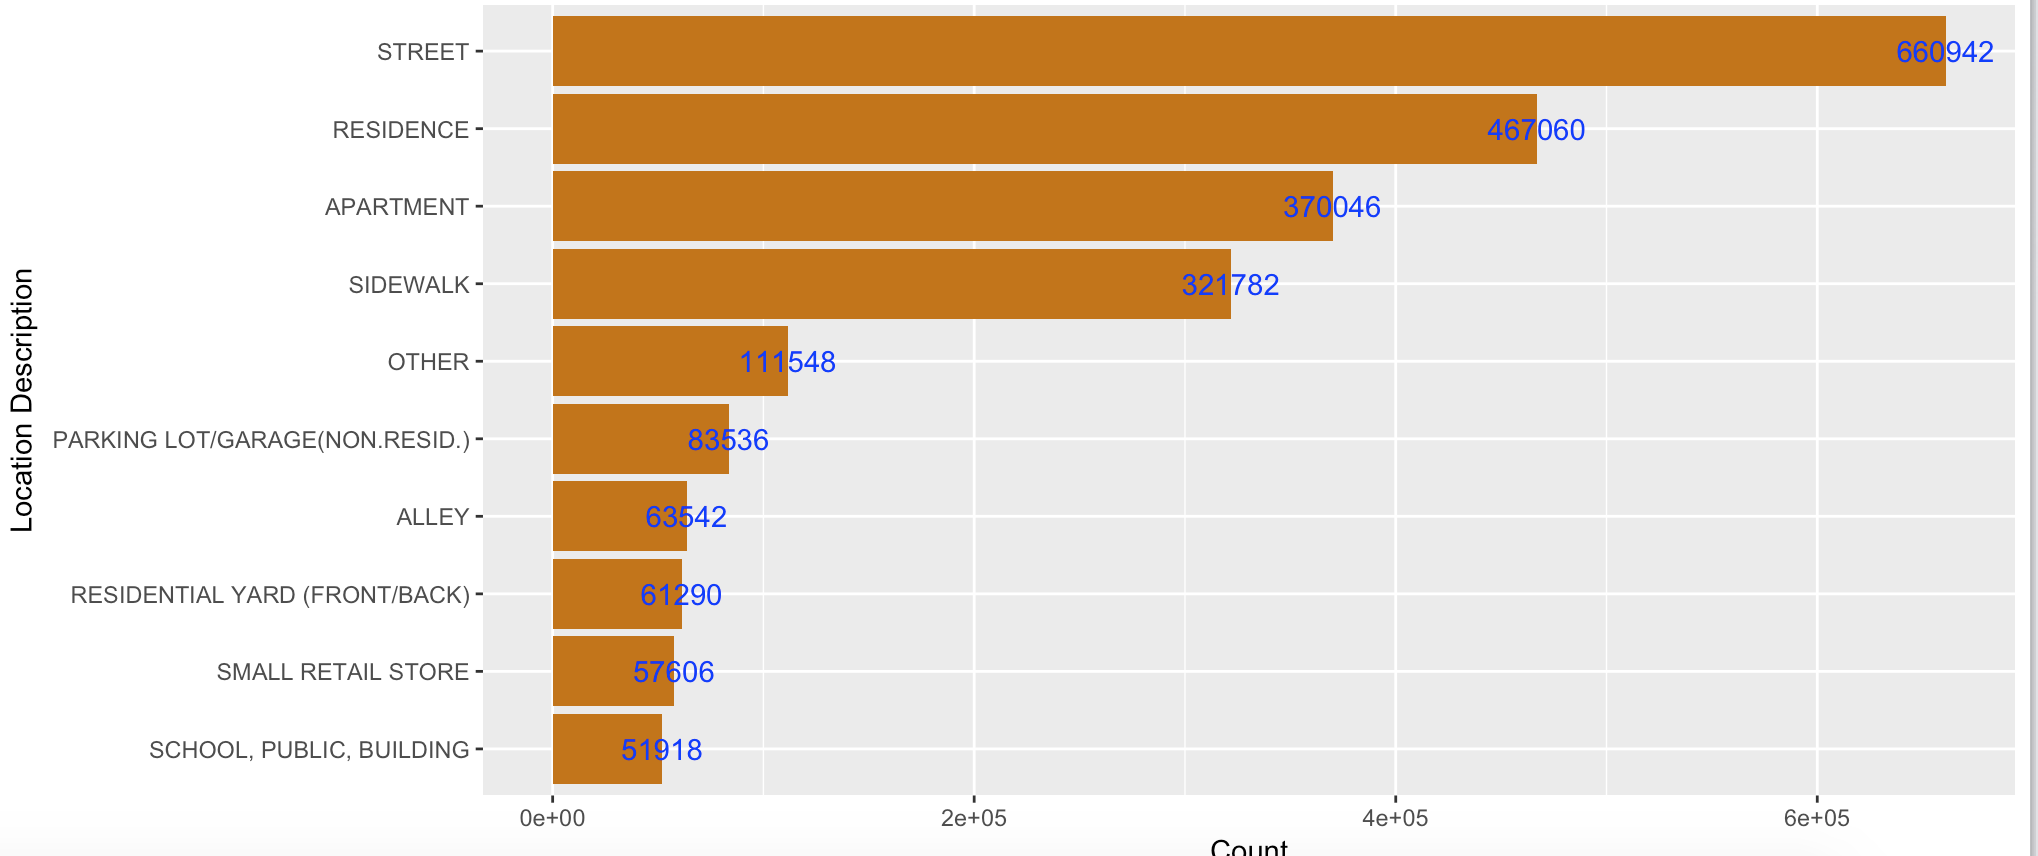
The aggregate() function allows you to run an aggregation pipeline. For example the following pipeline calculates the total crimes per location and then shows it using a horizontal bar plot which is shown in the graph after the code:
> library(ggplot2)
> crime_collection$aggregate('[{"$group":{"_id":"$LocationDescription", "Count": {"$sum":1}}}]')%>%na.omit()%>%arrange(desc(Count))%>%head(10)%>%ggplot(aes(x=reorder(`_id`,Count),y=Count))+geom_bar(stat="identity",fill='#c37600')+geom_text(aes(label = Count), color = "blue") +coord_flip()+xlab("Location Description")
Read now
Unlock full access


