September 2017
Beginner to intermediate
560 pages
25h 18m
English
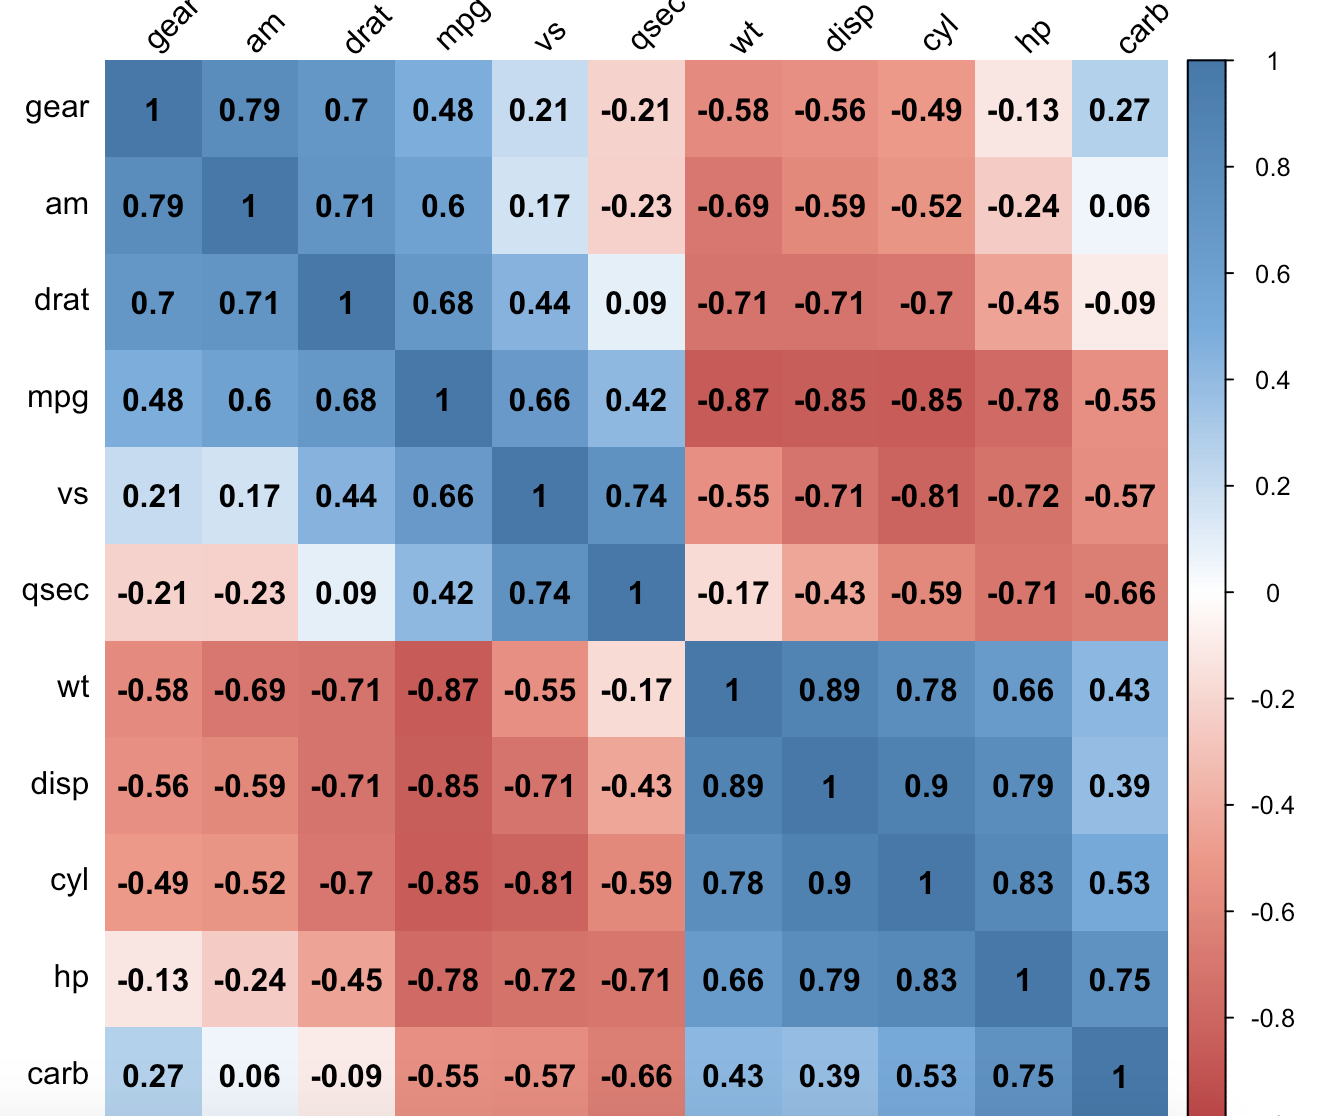
The corrplot() function has lots of options. You can create a lighter palette so that the text is readable by removing the color legend and ordering the correlated items closer together, using the order="AOE" option:
> col <- colorRampPalette(c("#BB4444", "#EE9988", "#FFFFFF", "#77AADD", "#4477AA"))> corrplot(mtcars_cor, method="shade", shade.col=NA, tl.col="black", tl.srt=45, col=col(200), addCoef.col="black", addcolorlabel="no", order="AOE")
To deal with NA values present in the correlation matrix, you can probably use the use="complete.obs" or use="pairwise.complete.obs option before plotting. Like many other standalone ...
Read now
Unlock full access


