September 2017
Beginner to intermediate
560 pages
25h 18m
English
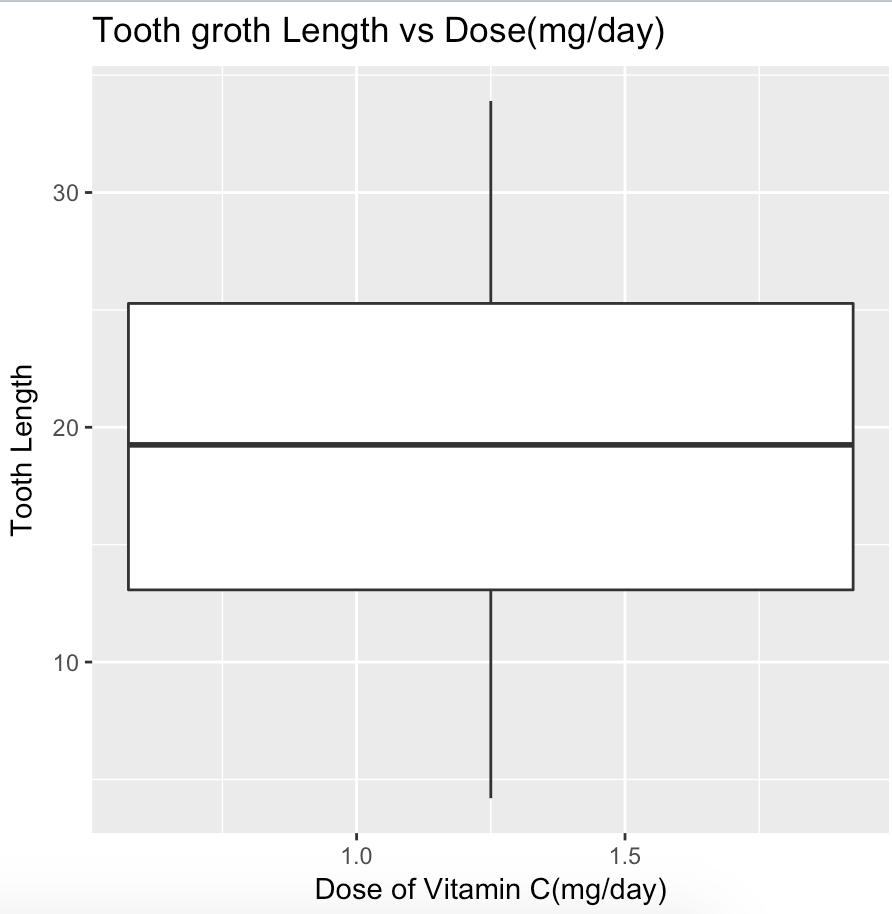
To add labels and legends, perform the following steps:
> p <- ggplot(toothgrowth, aes(x=dose, y=len)) + geom_boxplot()
> p + ggtitle("Tooth growth Length vs Dose(mg/day) ") + xlab("Dose of Vitamin C(mg/day)") + ylab("Tooth Length")
> p_leg <- ggplot(toothgrowth, aes(x=dose, y=len, fill=as.factor(dose))) + geom_boxplot()> p_leg + labs(fill = "Dose (mg)")
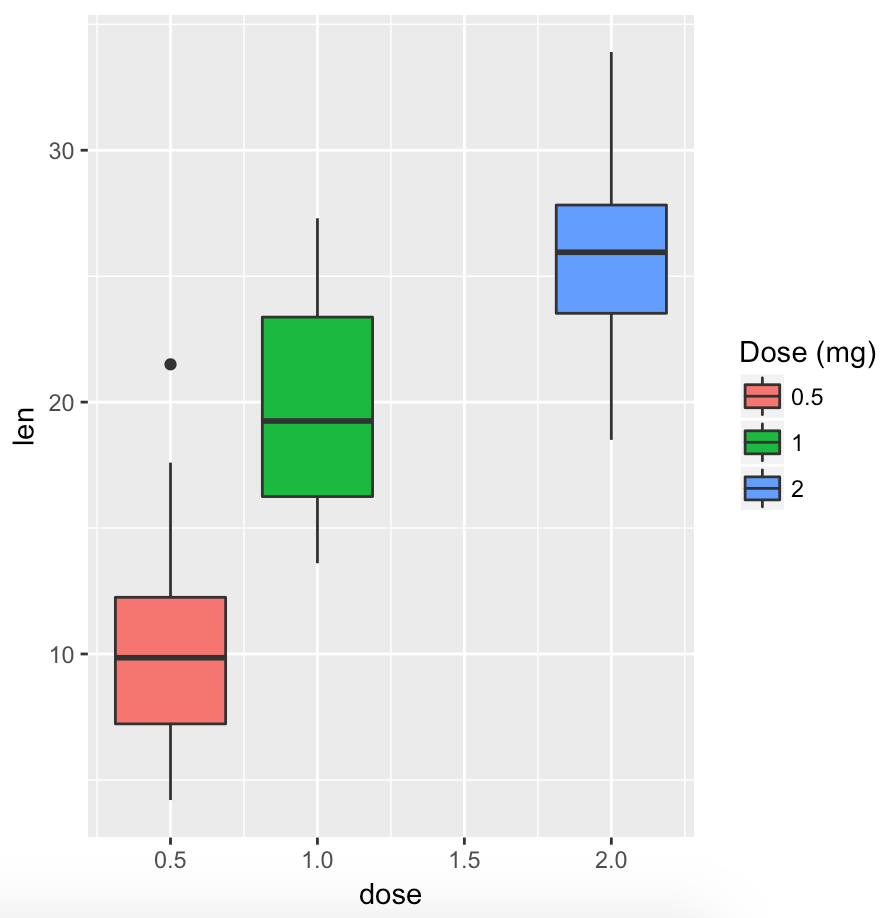
> p_leg + labs(fill ...
Read now
Unlock full access


