September 2017
Beginner to intermediate
560 pages
25h 18m
English
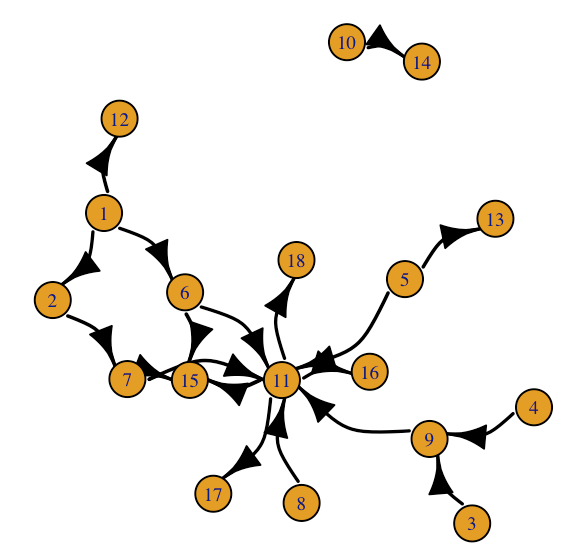
In step 4 of the main recipe, we created an undirected graph. Here, we create a directed graph object, dg:
> dg <- graph.data.frame(nw.new)
> # save for later use
> save(dg, file = "directed-graph.Rdata")
> plot.igraph(dg,edge.curved=TRUE,edge.color="black", edge.width=E(dg)$x/10,vertex.label.cex=.6)
On plotting the preceding graph, we get the following output:
Read now
Unlock full access


