June 2009
Intermediate to advanced
672 pages
19h 8m
English
We’ve seen several examples of how synthetic tests report data. Let’s look at a few other common representations of end user experience. One way of reporting performance is to segment it by region or carrier to identify the worst-served parts of the Internet, as shown in Figure 9-28.
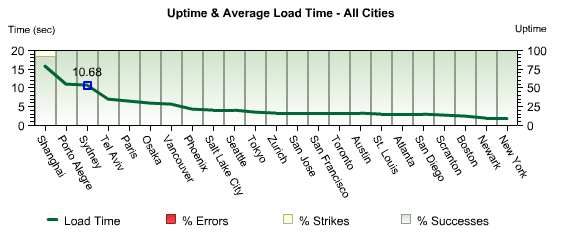
Figure 9-28. Webmetrics transaction performance report by geographic region for a site on the East Coast of North America
Segmented reports show you the slowest or least-available tests along a particular dimension. But what if you want to focus on a particular element of latency? Synthetic tests collect a great deal of data, and you need to look across all of it to properly understand what normal performance is like.
By displaying a metric—such as total transaction time—as a histogram, you can quickly see what kind of performance is most typical. On the other hand, you may not want to aggregate data, but rather see individual tests to better understand a particular period of time. In this case, a scatterplot visualization like the one shown in Figure 9-29 works well.
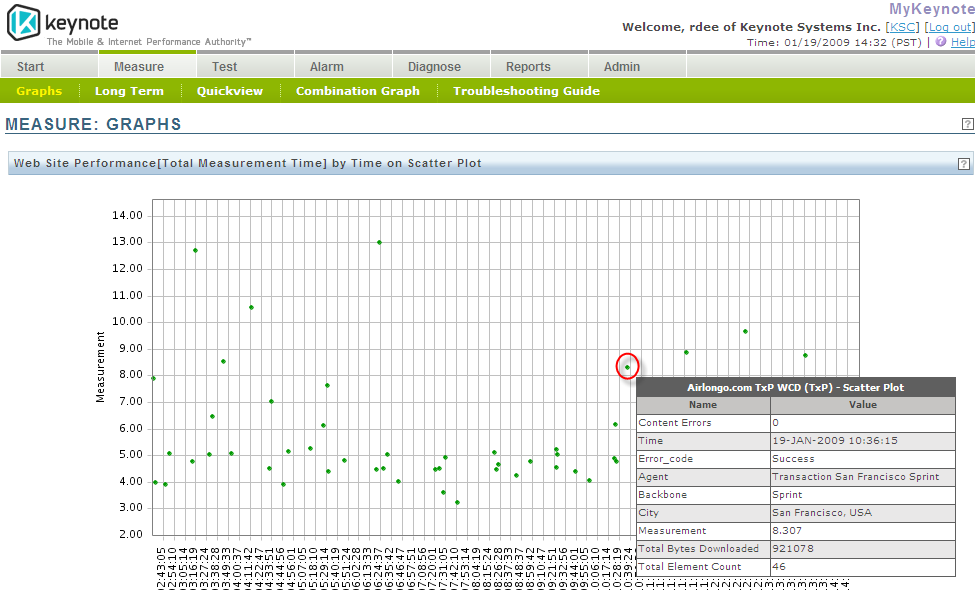
Figure 9-29. A scatterplot of individual test results
This kind of report is only available from services that keep the raw test data for considerable lengths of time. Some lower-cost services will aggregate this information ...
Read now
Unlock full access


 O’Reilly covers everything we've got, with content to help us build a world-class technology community, upgrade the capabilities and competencies of our teams, and improve overall team performance as well as their engagement.I wanted to learn C and C++, but it didn't click for me until I picked up an O'Reilly book. When I went on the O’Reilly platform, I was astonished to find all the books there, plus live events and sandboxes so you could play around with the technology.I’ve been on the O’Reilly platform for more than eight years. I use a couple of learning platforms, but I'm on O'Reilly more than anybody else. When you're there, you start learning. I'm never disappointed.I'm always learning. So when I got on to O'Reilly, I was like a kid in a candy store. There are playlists. There are answers. There's on-demand training. It's worth its weight in gold, in terms of what it allows me to do.