March 2019
Beginner
504 pages
11h 17m
English
Take a line chart and then fill in the area beneath the line. If there are multiple lines, then stack the filled areas on top of each other. That's how you might think of an area chart.
In fact, in Tableau, you may find it easy to create a line chart, like you've done previously, and then change the mark type on the Marks card to Area. Any dimensions on the Color, Label, or Detail shelves will create slices of area that will be stacked on top of each other. The Size shelf is not applicable to an area chart.
As an example, consider a visualization of patient visits over time, segmented by hospital branch:
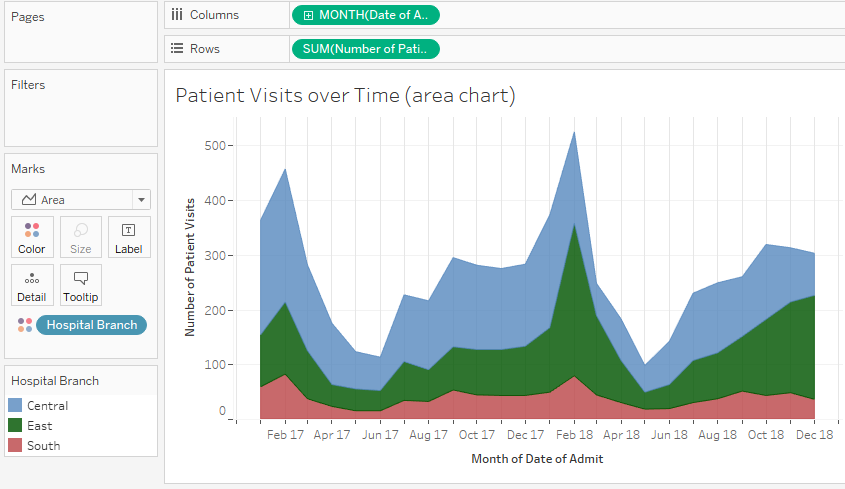
Each band represents a ...
Read now
Unlock full access


