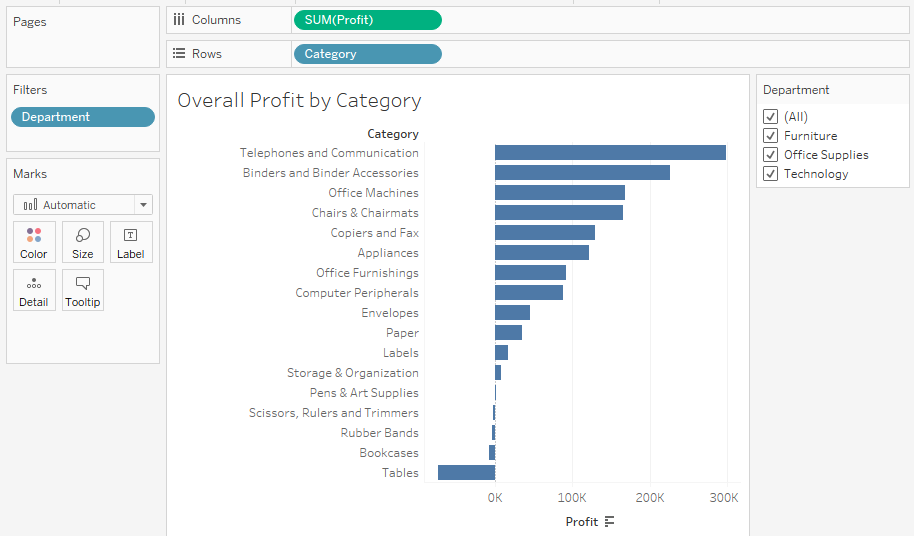
Use the Superstore Sales dataset and follow these steps to build the individual views that will form the basis of the dashboard:
- Create a bar chart showing profit by category. Sort the categories in descending order by the sum of profit.
- Add the Department field to Filters and show a filter. To accomplish this, use the drop-down menu of the Department field in the data pane and select Show Filter.
- Name the sheet Overall Profit by Category:
- Create another, similar view showing profit by item. Sort the items in descending order by the sum of profit.
- You'll notice that there are too many items to see at one time. For your ...