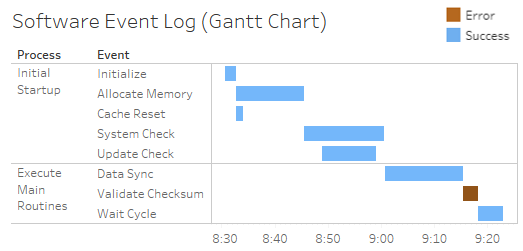
Gantt Charts can be incredibly useful for understanding any series of events with a duration, especially if those events have some kind of relationship. Visually, they are very useful for determining whether certain events overlap, have dependency, or take longer or shorter than other events.
The following Gantt Chart shows a series of processes that run when an application is started. Some of these processes run in parallel, and some are clearly dependent on others. The Gantt Chart makes these dependencies clear:

To create a Gantt Chart in Tableau, you can select the Gantt mark type on the marks card dropdown. This places a Gantt ...

