March 2019
Beginner
504 pages
11h 17m
English
Step Lines are often useful when you want to show discrete change over time, as opposed to a standard line chart where angled lines might imply a gradual change. For example, the number of generators running at any given time is a discrete whole number and you may wish to emphasize this fact with a Step Lines chart.
In the following example, we've taken the build-up of profit that was previously demonstrated with a Waterfall Chart and used Step Lines to show each successive step of profit:
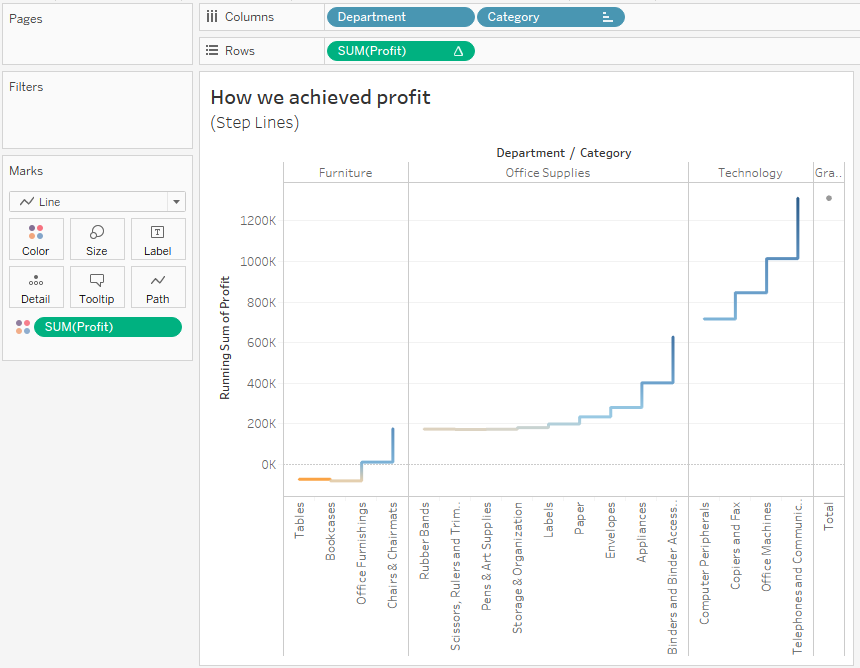
Overall, a Step Lines chart is very easy to create. Simply click the Path shelf and select the Step Lines from Line Type, as shown ...
Read now
Unlock full access


