March 2019
Beginner
504 pages
11h 17m
English
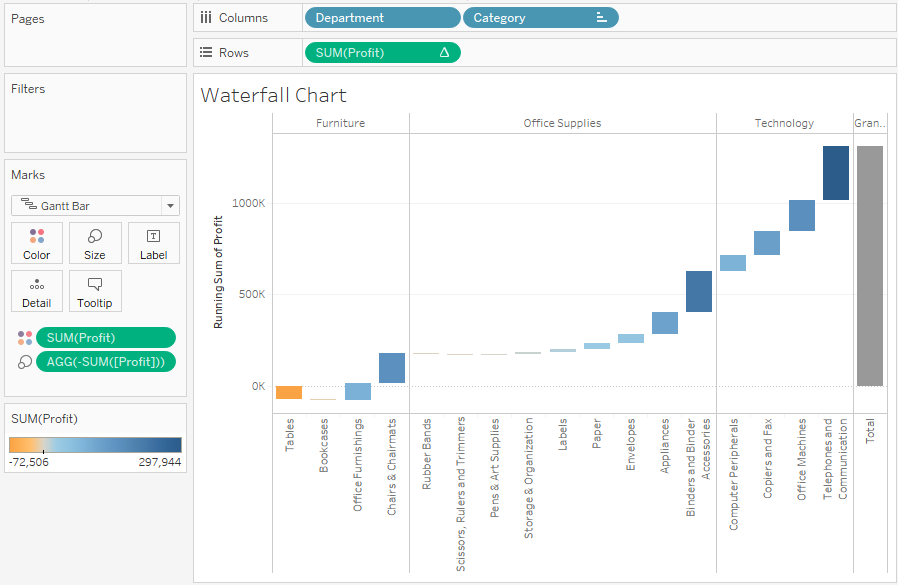
A Waterfall Chart is useful when you want to show how parts successively build up to a whole. In the following screenshot, for example, is a Waterfall Chart showing how profit builds up to a grand total across Departments and Categories of products. Sometimes profit is negative, so at that point the Waterfall Chart takes a dip, while positive values build up toward the total:
Here are the features and techniques used to build the chart:
Read now
Unlock full access


