March 2019
Beginner
504 pages
11h 17m
English
Often, you may want to compare year over year values. How much has our customer base grown over last year? How did sales in each quarter compare to sales in the same quarter last year? These types of questions can be answered using Year over Year Growth.
Tableau exposes Year over Year Growth as one option in the Quick Table Calculations. Here, for example, is a view that demonstrates Sales by QUARTER, along with the percentage difference in sales for a quarter compared with the previous year:
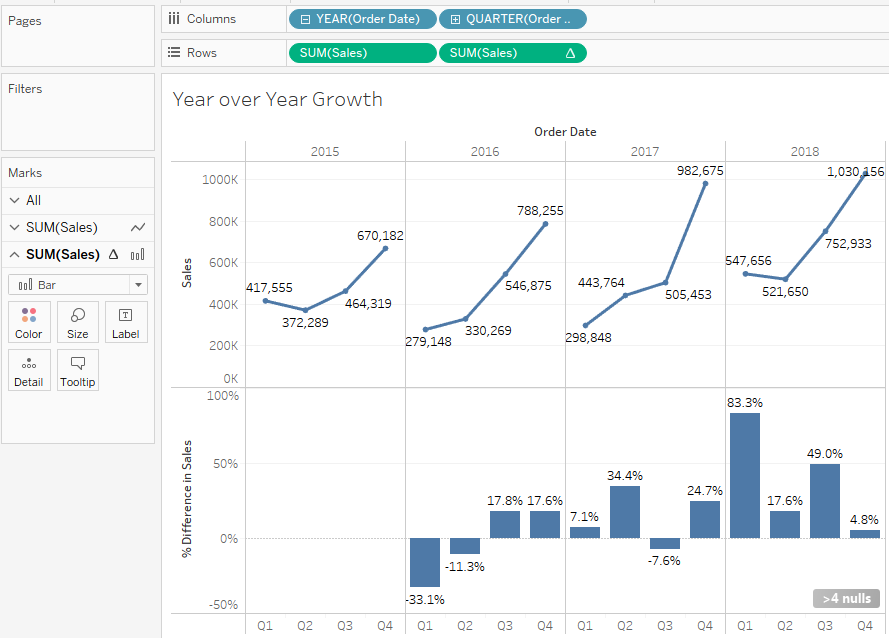
The second Sum(Sales) field has had the Year over Year Growth Quick Table Calculation applied (and the mark type changed to ...
Read now
Unlock full access


