March 2019
Beginner
504 pages
11h 17m
English
You can easily see the difference between wide and tall data in Tableau. Here is what the wide table of data looks like in the left data window:
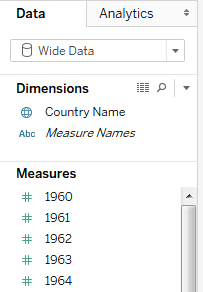
As we'd expect, Tableau treats each column in the table as a separate field. The wide structure of the data works against us. We end up with a separate measure for each year. If you wanted to plot a line graph of population per year, you will likely struggle. What dimension represents the date? What single measure can you use for population?
This isn't to say that you can't use wide data in Tableau. For example, you might use Measure Names/Measure Values to plot all of the ...
Read now
Unlock full access


