March 2019
Beginner
504 pages
11h 17m
English
The following screenshot shows a simple example of data blending in action:
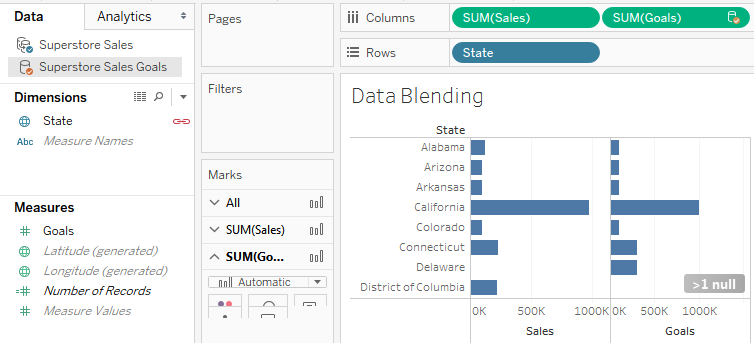
There are two data source connections defined in this workbook, one for the Superstore data and the other for Superstore Sales Goals. The Superstore data source is the primary data source in this view (indicated by the blue checkmark) and Superstore Sales Goals is the secondary source (indicated by the orange checkmark). Active fields in the view that are from the secondary data source are also indicated with an orange checkmark icon.
The Sales measure has been used from the primary source and the Goals from the secondary sources. In both cases, ...
Read now
Unlock full access


