March 2019
Beginner
504 pages
11h 17m
English
Another possibility for showing relationships between two values for each category is a bar-in-bar chart. Like the bullet chart, the bar-in-bar chart can show progress toward a goal, but it can also be used to compare any two values. For example, you might compare revenue to a target, or you might compare the revenue for the current year to the previous year:
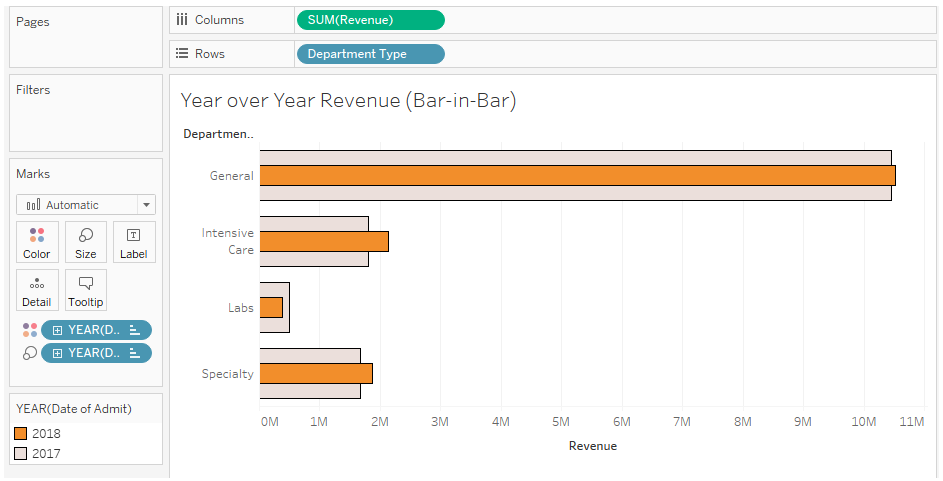
To create this view, continue in the same workbook and follow these steps:
Read now
Unlock full access


