March 2019
Beginner
504 pages
11h 17m
English
One very important feature in Tableau is the ability to use a dual axis. Scatterplots use two axes, but they are X and Y. You also observed in the stacked bar example that placing multiple continuous (green) fields next to each other on Rows or Columns results in multiple side-by-side axes. Dual axis, on the other hand, means that a view is using two axes that are opposite each other with a common pane.
Here is a sample view using a dual axis for Sales and Profit:
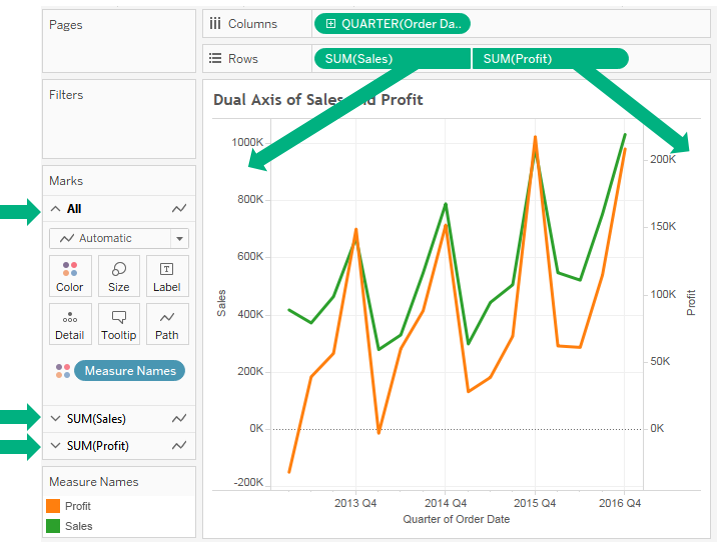
There are several key features of the view, which are as follows:
Read now
Unlock full access


