March 2019
Beginner
504 pages
11h 17m
English
In newer versions of Tableau, you may set transparency for visualizations used on dashboards. This enables all kinds of innovative approaches, such as layering visualizations on top of each other or over background images.
You'll find the following example in the Chapter 11 Complete workbook:

The dashboard consists of an image, a transparent chart over the image, and a title.
To make a visualization transparent, go to Format Shading and set the Worksheet shading to None:
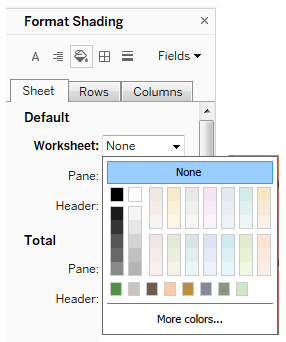
Once you have set the shading to None, the visualization ...
Read now
Unlock full access


