March 2019
Beginner
504 pages
11h 17m
English
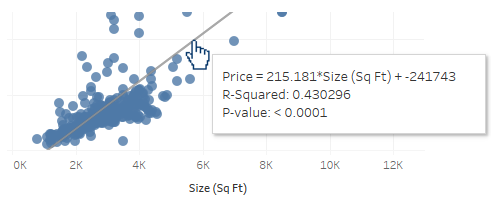
It can be useful to observe Trend Lines, but often we'll want to understand whether the trend model we've selected is statistically meaningful. Fortunately, Tableau gives us some visibility into the trend models and calculations.
Simply hovering over a single trend line will reveal the formula as well as the r-squared and P-value for that trend line:
Read now
Unlock full access


