March 2019
Beginner
504 pages
11h 17m
English
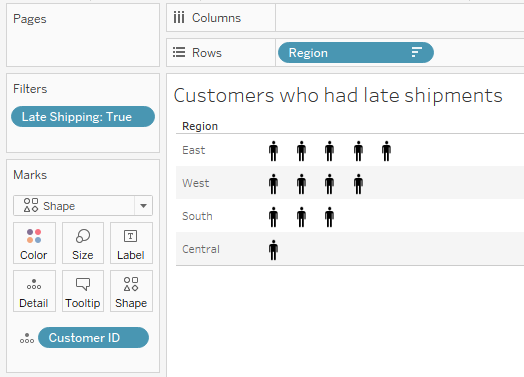
A unit chart can be used to show individual items, often using shapes or symbols to represent each individual. These charts can elicit a powerful emotional response, because the representations of the data are less abstract and more easily identified as something real. For example, here is a chart showing how many customers had late shipments for each Region:
The view was created with the following techniques:
DATEDIFF('day', [Order Date], [Ship ...Read now
Unlock full access


