March 2019
Beginner
504 pages
11h 17m
English
A Slope Chart shows a change of values from one period or status to another. For example, here is a Slope Chart demonstrating the change in sales rank for each state in the South region from 2016 to 2017:
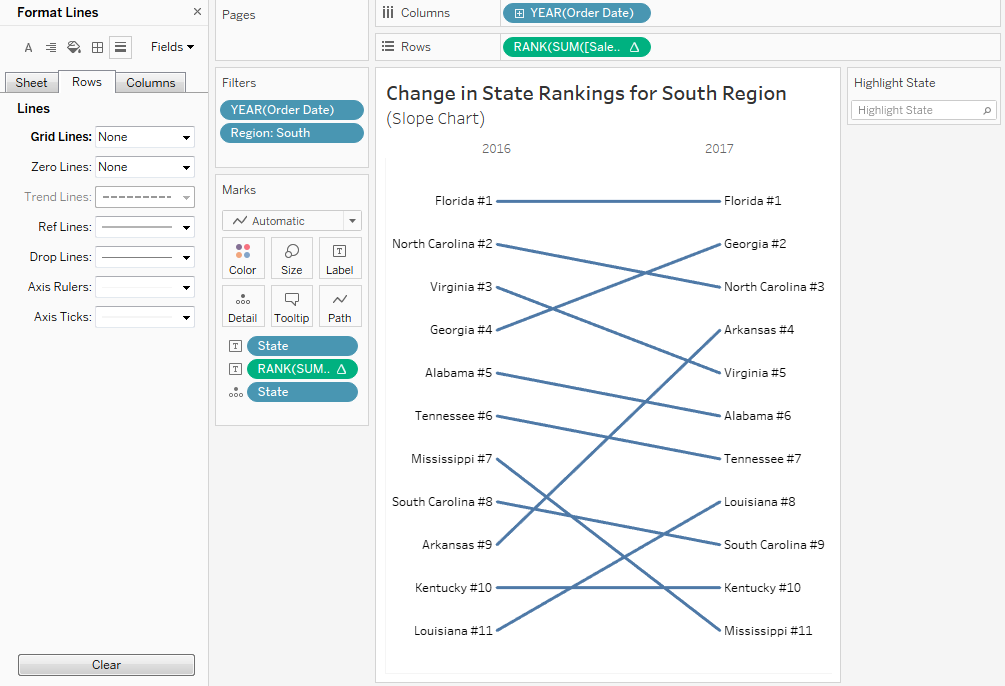
Here are some features and techniques used to create the preceding Slope Chart:
Read now
Unlock full access


