Chapter 87. Graph Shapes
You don’t need a deep knowledge of statistics to see interesting things in a graph. Human behavior makes a few basic shapes on a graph, and they all mean something.
There are two graph styles that human behavior creates fairly often: Traffic and Structured Behavior.
Note
I have used a bar graph in these examples because it was simpler to understand. Your analytics might use lines or dots or whatever. Don’t panic. They all do basically the same thing. That’s why we’re learning shapes, not graph types.
Traffic Graphs
These graphs show the number of people that did something, over time. Like the number of visitors per day. You can call that “traffic.”
Traffic will always be moving up and down a little because random things in the world happen every day, even when your site doesn’t change at all.
That’s why you can never assume that a small change in traffic was caused by a new feature or a design change.
Now, on with the shapes!
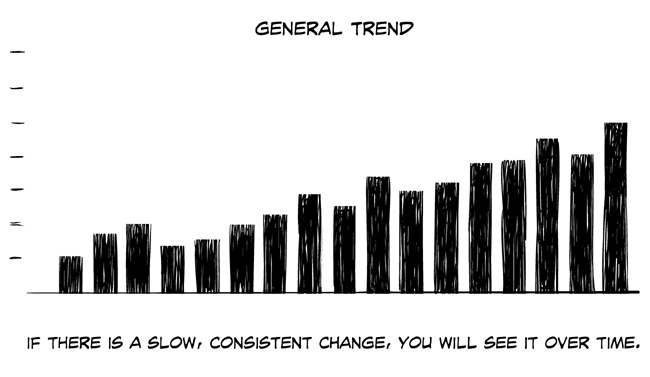
General Trend
If there is a slow consistent change, you will see it over time.
If it would be fairly easy to walk across your graph, and it shows a consistent “rise” or “fall,” then the trend is likely to continue, unless you change it.
Random/Unexpected/One-time event
People don’t suddenly change behavior without being provoked.
Did you run a weekend campaign? Or, is something technical causing problems on one of your pages? Or, maybe your startup ...
Get UX for Beginners now with the O’Reilly learning platform.
O’Reilly members experience books, live events, courses curated by job role, and more from O’Reilly and nearly 200 top publishers.

