January 2017
Beginner to intermediate
280 pages
217h 11m
English
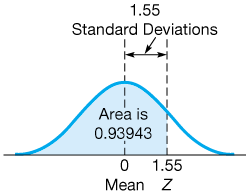
Example: To find the area under the normal curve, you must know how many standard deviations that point is to the right of the mean. Then the area under the normal curve can be read directly from the normal table. For example, the total area under the normal curve for a point that is 1.55 standard deviations to the right of the mean is 0.93943.
| 0.00 | 0.01 | 0.02 | 0.03 | 0.04 | 0.05 | 0.06 | 0.07 | 0.08 | 0.09 | |
|---|---|---|---|---|---|---|---|---|---|---|
| 0.0 | 0.50000 | 0.50399 | 0.50798 | 0.51197 | 0.51595 | 0.51994 | 0.52392 | 0.52790 | 0.53188 | 0.53586 |
| 0.1 | 0.53983 | 0.54380 | 0.54776 | 0.55172 | 0.55567 | 0.55962 | 0.56356 | 0.56749 | 0.57142 | 0.57535 ... |