August 2017
Beginner to intermediate
402 pages
8h 32m
English
When a report is added with a chart, did you know that, when you click on a segment in the chart, the report will be auto-filtered with the segment selected in the chart?
Let's say I have an opportunity report called Opportunities by Stage with the chart added. Following screenshot shows report with chart added:
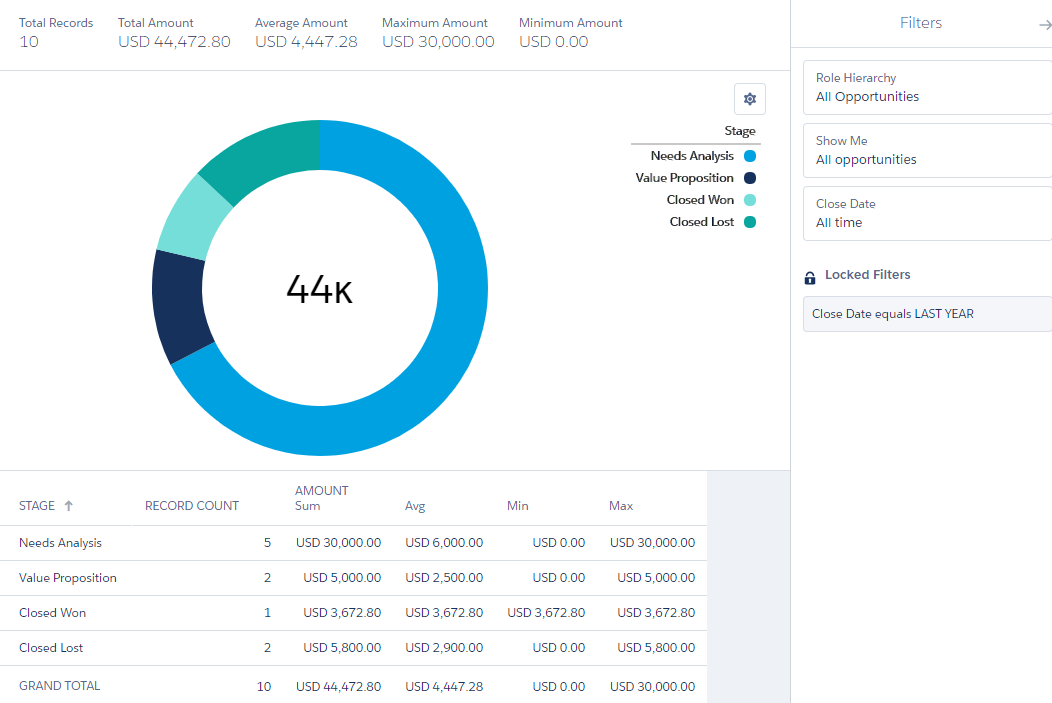
What I would like is to drill down only for opportunities with Stage = Needs Analysis. Since we have the chart here, I can just click on the blue segment in the chart, and the report will be automatically filtered with Stage = Needs Analysis:
To clear the chart filter, just click on the cross icon ...
Read now
Unlock full access


