7.3 GRAPHICAL CONVOLUTION
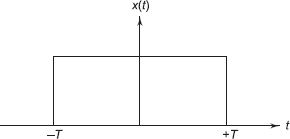
In this article graphical convolution is explained here. Let us consider two sided signal. Let us consider a signal shown in Fig. 7.1. let x1(t) and x2(t) are identical to x(t). Therefore,

Fig. 7.1 Signal x(t)
The meaning of the words ‘graphically process’ is to find x1(λ), x2(t – λ) and to multiply these two. The multiplication of these two gives the area under the function for a given ‘t’. From Fig. 7.2, x1(λ) is nothing but x(t) with the name of x-axis changed from t to λ. In Fig. 7.3, x2(λ) ...
Get Signals and Systems now with the O’Reilly learning platform.
O’Reilly members experience books, live events, courses curated by job role, and more from O’Reilly and nearly 200 top publishers.

