432 Cyber-Physical Systems: From Theory to Practice
100
80
60
40
20
0
1 5 10 20 50
Nodes per cell
100
2
% duty cycle active
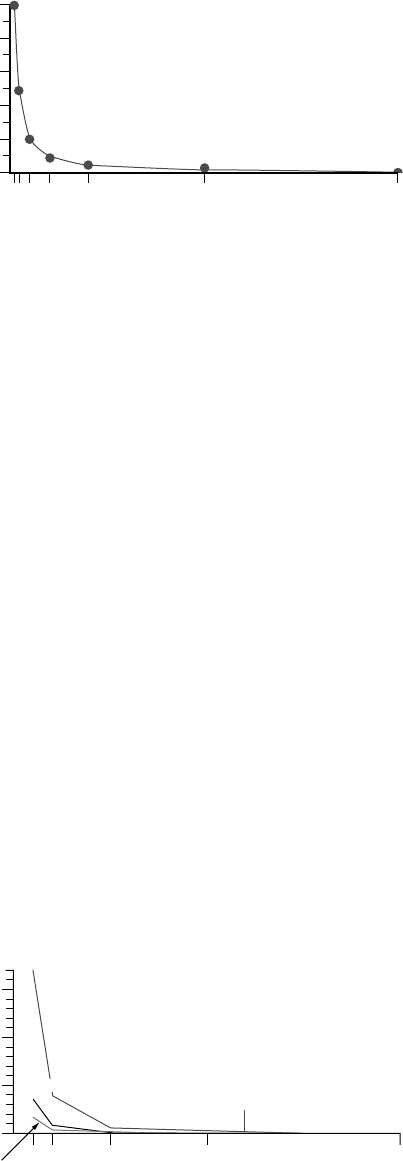
FIGURE 17.14 Percentage of active duty time versus number of nodes in a cluster.
Figure 17.14 shows that as the percentage of active duty cycle (the percentage of active time over
total node lifetime) is decreased the node density increases with K = 1 coverage. We expect this
percentage to follow the same trend but at less decline rate percentage as the K value increases since
more nodes must stay active.
Based on the simulation results shown in Figure 17.14, we expect the cluster head probing cycle
(T
h
is the time interval before sending ...


