A picture is worth a thousand words. Let's see what using forecasts is like:
Forecast view of a sales manager
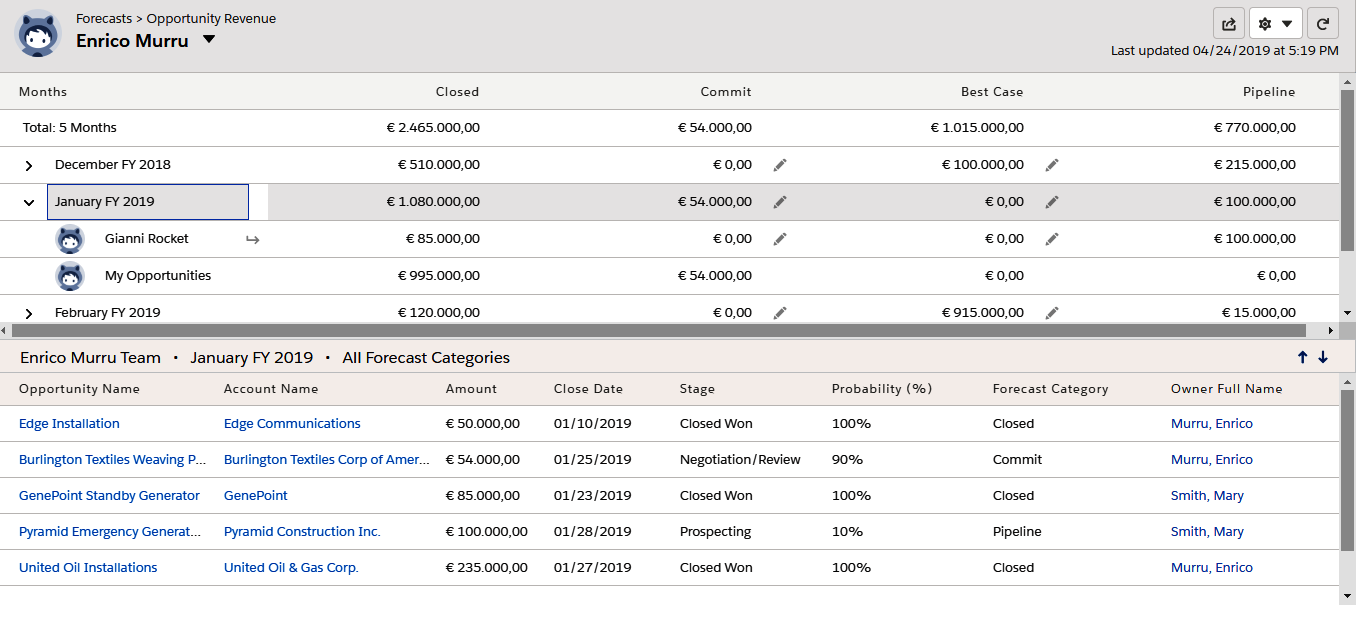
We can see two panels:
- The upper panel shows a cumulative view of all revenues in a 5-month time period, and for each month individually (this is the actual forecast). Each month's row also shows a number of rows related to the users below the current user's role. Each row shows the total revenue for each Forecast Category (from left to right, the probability that the deal is closed lowers).
- The lower panel shows the opportunities that concur on the selected time period (on the upper panel).