Using PerfMon
PerfMon includes a couple of important features: System Monitor and Data Collector Sets. Some servers have it installed in the Administrative Tools menu. It's also found at Control Panel → Administrative Tools → Performance Monitor, and it can be launched from SQL Server Profiler's Tools → Performance Monitor menu command.
System Monitor
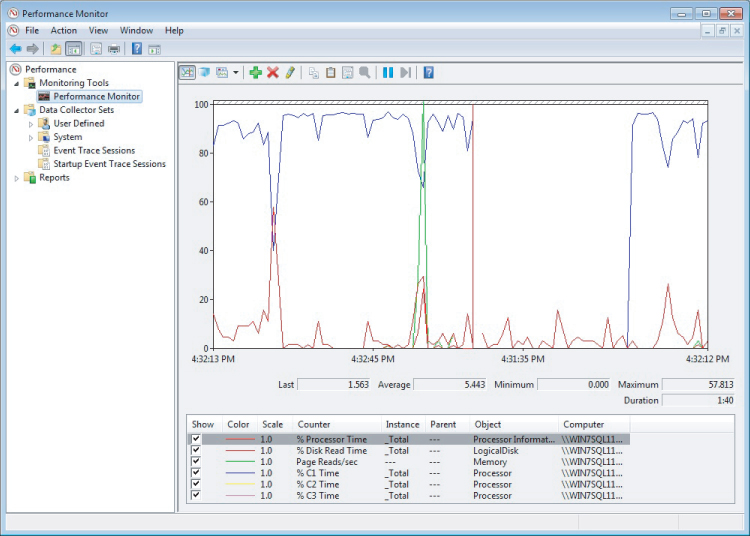
System Monitor, or SysMon, is familiar to anyone with experience with Windows server administration. System Monitor graphically displays multiple counters, aggregate and detailed data from the server internals. It looks a bit like a heart EKG monitor for Windows and SQL Server, as shown in Figure 37.1.
Figure 37.1 System Monitor is useful for watching the overall activity within SQL Server.

A performance counter can watch the local server or a remote server, so it isn't necessary to run System Monitor at the SQL Server machine. The counters can be watched as a timed line graph, a histogram bar graph, or a real-time report.
Counters are organized by object and, sometimes, instance. For example, (refer to Figure 37.1), the SQL Server: Databases object exposes many counters, including the Transactions/sec counter. This counter can be watched for All Instances (all databases on all instances on the selected server) or for a selected database.
Get Microsoft SQL Server 2012 Bible now with the O’Reilly learning platform.
O’Reilly members experience books, live events, courses curated by job role, and more from O’Reilly and nearly 200 top publishers.

