Running Profiler
SQL Server Profiler can be opened from several locations:
- From the Start menu, Profiler is under the SQL Server 2012 → Performance Tools menu.
- In Management Studio, Profiler is in the Tools menu.
- Within Management Studio's Query Editor, the context menu includes the option to Trace Query in SQL Server Profiler. This option opens Profiler filtered to the current connection.
Defining a New Trace
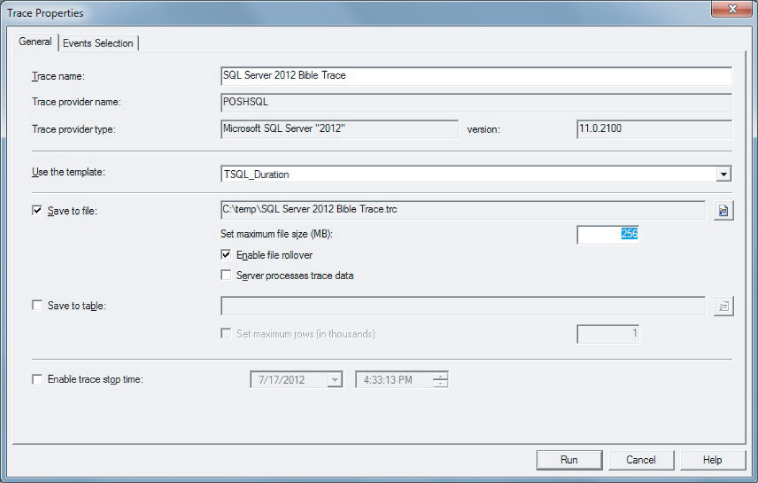
When a new trace is created (with the New Trace toolbar button or File → New Trace), a connection is created to a SQL Server, and the Trace Properties dialog (see Figure 38.1) displays. The Trace Properties General tab sets up the trace (name, file destination, and so on), and the Events Selection tab defines the events and data columns to be recorded, as well as the filter. If the trace is running, the properties may be viewed but not changed. You can save a trace configuration as a template to make creating new traces easier.
Figure 38.1 This SQL Server Profiler uses the T-SQL Duration template and can write information to a file.

A Profiler trace is primarily viewed interactively (because otherwise you should be running a scripted server-side trace), but the data can also be written to a file or a SQL Server table. This is useful for further manual analysis, viewing alongside System Monitor counter data, or importing into the Database Engine Tuning Advisor.
When Profiler ...
Get Microsoft SQL Server 2012 Bible now with the O’Reilly learning platform.
O’Reilly members experience books, live events, courses curated by job role, and more from O’Reilly and nearly 200 top publishers.

