Cubes
A cube brings the elements of the design process together and exposes them to the user, combining data sources, data source views, dimensions, measures, and calculations in a single container. A cube can contain data (measures) from many fact tables organized into measure groups.
Using the Cube Wizard has been covered in earlier sections, both from the top-down approach (see “Analysis Services Quick Start”) and from the bottom-up approach (see “Creating a Cube”). After you create the cube structure, you can refine it using the Cube Designer.
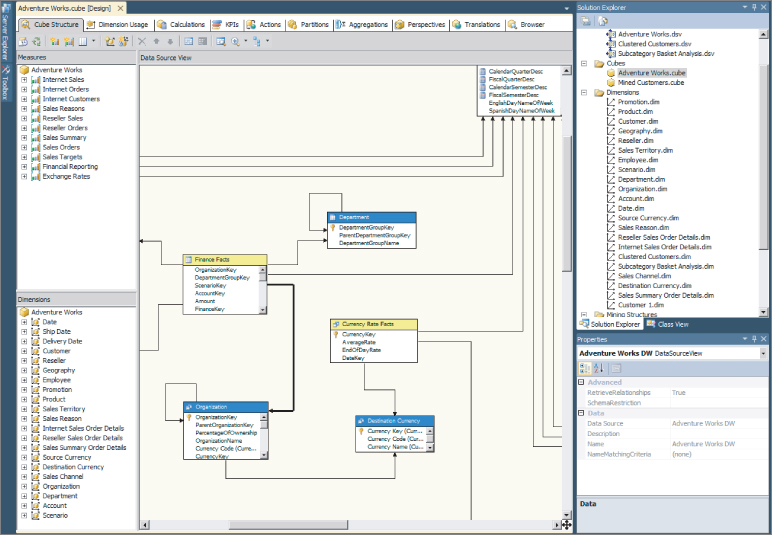
Open any cube from the Solution Explorer to use the Cube Designer, as shown in Figure 53.8. The Cube Designer presents information in several tabbed views described in the remainder of this section.
Figure 53.8 Analysis Services cube designer in solution explorer.

Cube Structure
The cube structure view is the primary design surface for defining a cube. Along with the ever-present Solution Explorer and Properties panes, three panes present the cube's structure:
- The Data Source View pane, located in the center of the view, shows a chosen portion of the data source view on which you can build the cube. Each table is color-coded: yellow for fact tables, blue for dimensions, and white for neither. A variety of options are available by right-clicking a table or the background, including hiding tables, showing tables, and showing related tables. ...
Get Microsoft SQL Server 2012 Bible now with the O’Reilly learning platform.
O’Reilly members experience books, live events, courses curated by job role, and more from O’Reilly and nearly 200 top publishers.

