... follow the pattern, the narrower this region becomes. The employment data track the line very closely during the period summarized by the line.
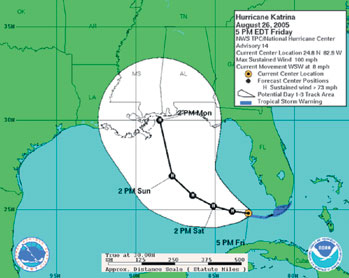
Figure 1.4 Projected path for Katrina.
To get a forecast, we extend the pattern. It is easy to extend the line beyond the data, as in Figure 1.3. The line passes above the count for October. This model predicts employment to be near 134,150,000 in October 2005, about 90,000 more than the reported count. That’s close to the value claimed in the news reports mentioned at the beginning of this subsection. We can also extend the region of uncertainty around the line. We should not expect counts of employment ...
Get Statistics for Business: Decision Making and Analysis, 3rd Edition now with the O’Reilly learning platform.
O’Reilly members experience books, live events, courses curated by job role, and more from O’Reilly and nearly 200 top publishers.

