Real Investments
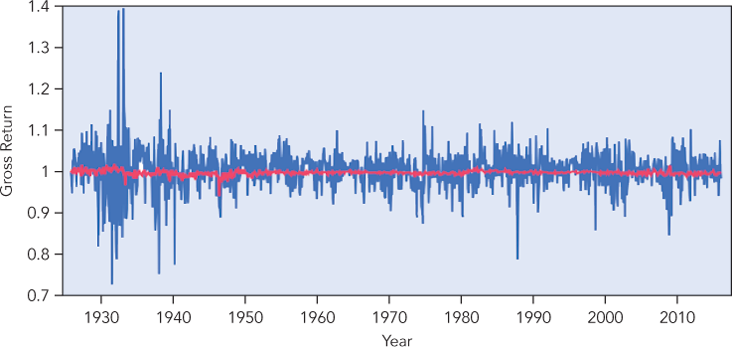
We made up Red, but you can buy Green and White today. The timeplot in Figure 3 shows monthly gross returns for the whole U.S. stock market and Treasuries (minus inflation). The month-to-month variation of returns on Treasuries is much smaller than the variation in returns on stocks. The returns on Treasuries seem constant compared to the gyrations of the stock market.

Figure 3 Historical monthly gross returns of stocks (blue) and Treasury Bills (red).
Several memorable events are apparent in Figure 3. The Great Depression occurred in the late 1920s and through the 1930s. The coming of the Second World War brought calm to the ...
Get Statistics for Business: Decision Making and Analysis, 3rd Edition now with the O’Reilly learning platform.
O’Reilly members experience books, live events, courses curated by job role, and more from O’Reilly and nearly 200 top publishers.

